
25 July 2023
How to interpret the latest house price predictions
Within a week of each other, both these headlines recently appeared in the same UK newspaper:
“UK house prices tick up despite surging mortgage rates”
…and…
“UK house prices fall 2.6% in biggest annual drop since 2011”
How, you ask, can two such different pictures be presented in such a small timeframe, in the same pink 22×14 inch pages?
It’s because, as regular readers will remember, the FT will be excitedly reporting on two announcements from two different lenders – Nationwide and Halifax – whose monthly lending figures traditionally vary somewhat, and are released a few days apart. Of course, the FT neglects to point this out, simply sensationalising each worldview in its own bubble, without cross reference.
Meanwhile, the Evening Standard reported that Halifax themselves caused “absolute carnage” on the High Street with their recent rate rise.
And then, when Rightmove release their asking price figures, it gives the newspapers yet another opportunity to get excited, as the listings site’s numbers for the same month will differ from what the lenders actually lent. Finally, in a couple of months’ time, the ONS will release their considered findings on what really happened during that month, but by then, the world has moved on to completely new lenders numbers to get excited about.
And so it goes on…
So, let’s try and cut through the Kaleidoscope of confusion. First, how do the commentators’ estimates compare now?
HOW THEY COMPARE: JUNE 2023
| Monthly change | Annual Change | Average House Price | |
| Halifax | -0.4% | -2.6% | £285,932 |
| Nationwide | +0.1% | -3.5% | £262,239 |
| Rightmove | 0% | +1.1% | £372,812 |
| Zoopla | N/A | +1.2% | £261,100 |
Table 1
As you can see, there’s quite a gap between some of these markers. So, to find out what actually happened, we need to look back to April, so we can bring in the transactional stats from the Office for National Statistics:
HOW THEY COMPARED: MAY 2023
| Monthly Change | Annual Change | Average House Price | |
| Halifax | 0% | -1.0% | £286,532 |
| Nationwide | -0.1% | -3.4% | £260,736 |
| Rightmove | -1.8% | +1.5% | £372,894 |
| Zoopla | N/A | +1.9% | N/A |
| ONS UK HPI/OBR | 0% | +1.9% | £285,861 |
| Acadata | -0.2% | +2.0% | £373,066 |
Table 2
And here we see (as so often) that the ONS average house price correlates very closely with the Halifax’s estimate – but the annual change figure is significantly different. It should be noted that the ONS annual change includes falls totalling 4% since October (when the YOY growth figure was 12.6% and the average house price was £296,422), followed by a 0.5% rise to April and a flat month to March.
Still, it’s worth remembering that in the Real World, there’s no such thing as an average house or average house price growth, except on an economist’s spreadsheet.
For example, the average asking price for a 4/5 bed detached top-of-the-ladder home in Wales rose by 31% during lockdown – whereas your average first time buyer, 1-2 bed property in London only crept up by 4 per cent. This leads Rightmove to predict that each sector and segment of the market is likely to work at different speeds next year. Rightmove’s data expert, Tim Bannister, suggests a crash will be avoided but prices will fall, punishing sellers who failed to sell because they over valued and buyers who over paid in the last 12 months. Homeowners, of course, don’t necessarily see homebuying as a short to medium term investment and won’t be fazed by not getting the timing perfect.
WHY ARE THE FIGURES SO DIFFERENT?
Why the discrepancies? Well, it’s all down to how the statistics are gathered, and what they relate to.
So just to summarise our last blog piece on this subject, the main voices we listen to in the UK are:
THE LENDERS – GIVE US PROMPT BUT INCOMPETE INFORMATION
- Halifax, which publishes reports every month estimating the typical cost of a house, based on the purchase prices of transactions it has financed. Owned by Lloyds, which at 18%, has the largest share of the mortgage lending market (£56bn).
- Nationwide, which does the same, but based on data from mortgages it has approved.
The UK’s two biggest lenders give us a pretty up to date snapshot of what’s happening, but since they only use their own mortgage approval data – and exclude cash transactions (a third of the market) – the picture they give us can be incomplete and they can differ in their average house price figures by up to 10%!
So, to get a more holistic view, we also look at:
THE AGENTS – WHO GIVE US CURRENT ASKING PRICES, BUT NOT ACTUAL SALE PRICES
- Rightmove. The UK’s biggest property sale portal, uses the house prices shown on the site. It’s as fast with its figures as Halifax and Nationwide, and having a much larger sample size than either of them, it gives a bigger picture, since it’s not based on the transactions of a single business. However, it’s still just an index of asking prices rather than a measure of the change in actual sale values, and it tends to come in much higher than the final ONS mark.
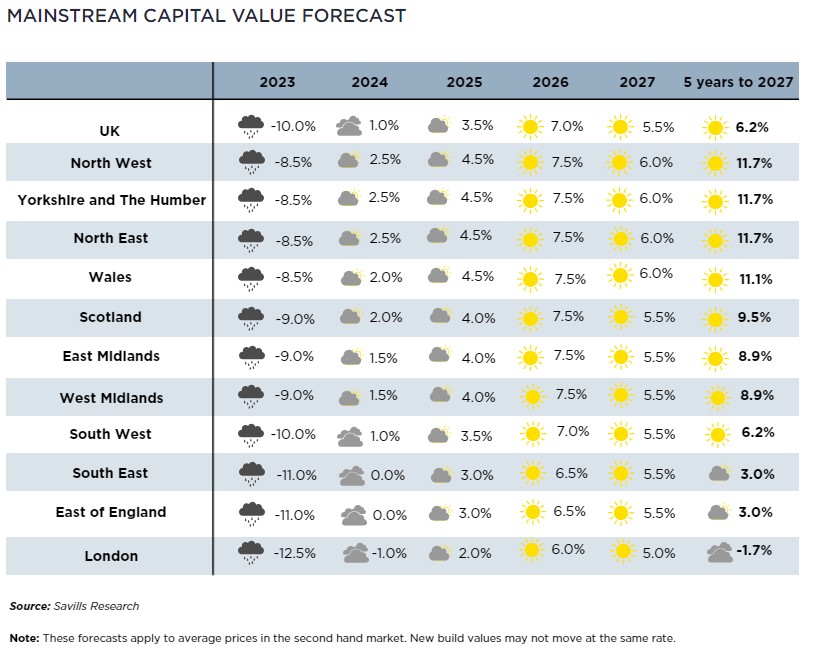
- Savills. Like Halifax and Nationwide, this global estate agent uses a combination of its own data, official figures, the data analysts Oxford Economics and historic patterns to predict future trends.
- Zoopla. This property sale website uses HM Land Registry, Registers of Scotland, official survey records, Royal Mail and Ordnance Survey as well as their own listings to predict price movements, so its figures are published a few weeks after the other property sites – more in line with the analysts. However, they haven’t tended to align their conclusions with ONS, despite using similar data.
So then we have to take their figures with a pinch of:
THE ANALYSTS – COMPREHENSIVE BUT LAGGING BEHIND
- ONS UK House Price Index (HPI). The ‘official’ statistics – the most comprehensive and reliable index there is. It’s based on actual transaction data from HM Land Registry, Registers of Scotland, Land and Property Services Northern Ireland and official mortgage and Council Tax data (to analyse buyer types) – but suffers from data lag, and long term comparison is not possible because methodology changed over the Covid period.
- Acadata. Also based on the Land Registry, but because they only cover England and Wales, they turn around a bit faster than UK HPI
THE FORECASTERS – GAMELY TRYING TO NAIL A MOVING TARGET
- OBR. The Office for Budget Responsibility produces a short term forecast for the current and next quarter – and, of course, provides the advice the Government heeds. This is based on such indicators as survey data from Royal Institution of Chartered Surveyors and GfK, and mortgage lending data from the Bank of England. The two variables they consider most important in fiscal forecasts: house prices, as measured by the ONS house price index, and the number of transactions reported by HMRC. Multiplying these figures together (i.e. total transactions x the average price) gives them the aggregate value of property transactions.
- Capital Economics. Respected independent economic forecasting consultancy taking in a variety of information sources and offering occasional updates on the state of the housing market. Don’t generally report on current data, but use it to forecast. Further forecasts are also available from Oxford Economics.
So to revisit where we left off last time – the latest complete figures we had were from October 2022, and these included the various predictions for where prices would go in 2023.
HOW THEY COMPARED: OCTOBER 2022
Hindsight allows us, once the analysts’ figures of what houses actually sold for, to compare the figures with the Agents’ asking prices/ Once again, Halifax was closest to the ONS figures after the tide went out.
| Monthly change | Annual Change | Av. House Price | Predicted drop 2023 | |
| Halifax | -0.4% | +8.3% | £292,598 | -8% |
| Nationwide | -0.9% | +7.2% | £268,282 | -5% |
| Rightmove | -0.9% | +7.2% | £371,158 | N/A |
| Savills | -0.9% | +9.5% | N/A | -10% |
| Zoopla | N/A | +7.2% | £261,600. | -5% |
| ONS UK HPI/OBR | +0.3% | +12.6% | £296,000 | -9% |
| LDL Acadata | +0.8% | +8.8% | £375,275 | N/A |
| Capital Economics | N/A | N/A | N/A | -8% |
Table 3
As you can see, the ONS’s May annual growth figure of 1.9% (Table 2) makes the above predictions look especially gloomy – but we’re only halfway through the year, and interest rates have only just started to reach pain points. There’s a long way to go before we experience the sort of distress experts were predicting back then, and it’ll be interesting to see what July’s actual figures are when the ONS releases them in September.
Capital Economics predicted an 8% drop over the year and revised up their 2024 prediction from 5% to a 12% total drop by mid 2024, adding, “We are not expecting a repeat of either 2008 or 1990, when house prices fell by about 20pc. First, while the house price to earnings ratio is roughly the same now as in 2007 we do not anticipate a return to pre-financial crisis mortgage rates of 6pc, so the cost of mortgage repayments will remain much less of a burden”.
In November, Halifax owners Lloyds’ annual prediction was: Base case scenario – house prices “may fall by 8% in 2023, with a peak-to-trough fall of 10%”.
However, its “Severe Downside” scenario was that prices might fall by as much as 17.9% in the same timescale if interest rates reached 7% and inflation at 14%.
Now as we all know, in June, interest rates on two year mortgages topped 6%, and then on 4th July 2023, rates for five year fixed mortgages also broke the 6% mark while the ONS Consumer Prices Index chalked up annual inflation at 8.7% to May 2023 – down from 11.1% in the year to October 2022 – a 41 year high.
And while one of the Bank’s key worries is nobody knows where interest rates will peak, when it stress tested mortgages last year, it pegged the nightmare scenario at 6 per cent – but suggested this was an eventuality ‘not expected or likely to materialise’.
The markets thus priced in an absolute zenith of 4.5 per cent. So, now that interest rates are touching 6.25 per cent, we’re actually living in the Bank’s worst case scenario – and beyond that predicted by Capital Economics – yet house prices have yet to reflect it.
THE VIEW FROM THE FRONT
So where do our most up to date commentators think we are now? What did Halifax and Nationwide actually say to trigger the two headlines we opened with?
Well, commenting on June’s release of figures, Robert Gardner, Nationwide’s Chief Economist, said that thanks to inflation not coming to heel as the bank expected, “Longer term interest rates (which underpin mortgage pricing) have increased sharply in recent months”. As a result, investors expect even more rate rises, and for them to stay high for a while.
Gardner went on to say that although longer term borrowing costs are now at levels not seen since the “Kamikaze” mini Budget last year, they haven’t had the same dampening effect on the market yet. Mortgage applications hadn’t declined markedly and “indicators of consumer confidence have continued to improve, though they remain below long run averages.”
However, despite the cost of living crisis, high borrowing costs, and the fact that deposits required are still above 2007/8 levels, Gardner still felt “a relatively soft landing is still possible, providing the broader economy performs as we (and most other forecasters) expect”.
“Labour market conditions,” he maintains, “are expected to remain relatively robust, with the unemployment rate remaining below 5%, while income growth is projected to remain solid. With Bank Rate likely to peak in the quarters ahead, longer term interest rates should also start to fall back.
“As a result, a combination of healthy rates of income growth and modest price declines should improve affordability over time, especially if mortgage rates moderate.”
His optimism derived from the assertion that up to 40% of fixed rate mortgages will have refinanced by the end of 2024 – and while borrowers will of course be paying a lot more in the coming years, they’ll have been stress tested at higher rates than we’re seeing even now, so they should be able to cope.
He’s further cheered by the assurances that “incomes have been rising at a solid pace in recent years, and lenders’ avowed willingness to work with borrowers this time around, so we’re likely to avoid the mass forced selling that might precipitate a crash.
At Halifax – whose annual drop of -2.6% is the biggest since June 2011 – the mood is much the same, despite the difference in the numbers.
Mortgage Director Kim Kinnaird commented on the June figures: “With markets now forecasting a peak in Bank Rate of over 6%, the likelihood is that mortgage rates will remain higher for longer, and the squeeze on household finances will continue to put downward pressure on house prices over the coming year.”
Addressing the rate of decline, he explained that it “largely reflects the impact of historically high house prices last summer…supported by the temporary Stamp Duty cut.”
He further ventured that the annual growth figure “also masks the fluctuations we’ve seen in the market over the past 12 months, with the buoyant claim that “average house prices are actually up by +1.5% so far this year, with most of that growth coming in the first quarter, following the sharp fall in prices we saw at the end of last year in the aftermath of the mini budget”. So things aren’t entirely as black as they’re painted, although they may be a gloomyish shade of grey.
“These latest figures do suggest a degree of stability in the face of economic uncertainty, and the volume of mortgage applications held up well throughout June, particularly from first time buyers,” Kinnaird continued, “That said, the housing market remains sensitive to volatility in borrowing costs.”
The squeeze on affordability will put a drag on demand, he feels, although the flexibility of lenders (and innovative range of options) will serve to mitigate the worst effects.
Kinnaird concludes, “How deep or persistent the downturn in house prices will be remains hard to predict. Consumer price inflation is likely to come down in the near term as energy and food prices look set to reverse their steep rises, but core inflation is clearly proving stickier than originally expected.
SO WHAT DO THE AGENTS SAY?
Savills
The estate agent’s UK Housing Market Update for July 2023 summarised that the recent spike in mortgage rates – while the full effect has yet to take hold – will suppress future loan approvals (still 23.9% below the pre-covid average) and make future falls more likely.
The low approvals, in turn, will continue to drag down completed transactions – already down 22.8% on the 2017-19 average (HMRC), while the RICS May survey portends that increased supply and falling demand will put the brake on prices.
The high mortgage rates are due to inflation sticking higher for longer than lenders had priced in – partially driven by strong wage growth (which cushioned the effect of the affordability shock).
Forced sales will be limited by the Government’s Mortgage Charter on the 23rd June, which allows extensions to mortgage terms, switching to interest only mortgages for six months, and a twelve month repossession hiatus.
Savills’ Head of Residential Research Lucian Cook says, “the housing market will remain price sensitive over the remainder of 2023 and into 2024, meaning prospective sellers will need to remain realistic about the price at which they market their property.”
However, he tempered these words by adding that the demand from cash buyers and remortgage help from lenders will parachute any falls.
Despite all the above, Savills’ five year forecast published on their research site hasn’t been updated and presumably remains unchanged.
Zoopla
The online agent’s June roundup suggests its prediction of 5% house price falls in 2023 look increasingly likely to come true, with market activity ‘set to slow further as mortgage rates edge towards 6%’.
The worst of it’s likely to hit the more expensive areas, such as the South East, South West, East Midlands and East of England, with prices already falling year on year in London (-0.2%) and Northern Ireland (-0.8%)
THE ANALYSTS’ PERSPECTIVE
The UK HPI
Beyond their headline stats in Table 2, the HPI’s April 2023 analysis said that annual house price inflation was “highest in the North East where prices increased by 5.5% in the 12 months to April 2023”. London came bottom of the regional YOY growth table for England with a rise of just 2.4% in the 12 months to April 2023.
The Royal Institution of Chartered Surveyors’ (RICS’) June 2023 UK Residential Market Survey indicated that interest rates appeared to have further suppressed buyer demand in June, while the Bank of England’s Agents summary of business conditions 2023 Q1 pointed to a modest pick up in secondary market activity and requests for valuations, and said demand was roughly equal to the supply of properties available, despite the RICS report of an imbalance.
Seasonally adjusted transactions over £40,000 were estimated by the UK Property Transaction Statistics to have reached 74,360 in May – 25% lower than May 2022. Over the same period, seasonally adjusted UK transactions dropped by 7.9%, while mortgage approvals fell from 51,500 to 48,700, according to The Bank of England’s Money and Credit April 2023 release.
Acadata
The only pertinent addition to the above from Acadata was that commute times are resuming their importance in buying decisions, which will redress the price balance between cities and their environs.
THE VIEW FROM THE FORECASTERS
The OBR
The Office’s March 2023 forecast predicted house prices falling by 10 per cent from their high in the fourth quarter of 2022, dragged down – no surprises here – by “low consumer confidence, the squeeze on real incomes and mortgage rate rises”.
Capital Economics
Only a last February, Andrew Wishart, Chief Economist Capital Economics, was voicing fears that house prices would have to fall by more than a fifth to bring mortgage affordability back to last year’s level.
Bank of England figures had shown the average five year fixed rate mortgage had jumped from 2.35pc to 4.6pc for homeowners with a 25pc deposit, and average repayments had surged from £985 to £1,254 in 12 months, according to Hamptons estate agents.
The firm’s predicted 12pc drop in house prices this year was based on expectations that fixed mortgage rates would fall to more affordable levels before 2024.
But swap rates – determined by market expectations of future interest rates, and which fixed mortgage rates are often based on – carried on going up.
The five year swap rate rose to 4pc from 3.3pc in just a few weeks. Two year swaps, which influence two year fixed rates, have also climbed since the end of January.
Which meant even a double digit drop in values this year could still leave mortgage repayments higher than they were a year ago, if fixed rates failed to drop as much as hoped.
Andrew Wishart warned that the return to mortgage rates of around 6% for the first time since 2007 “guarantees a renewed slump in mortgage lending and a further leg down in house prices”.
“If mortgage rates fail to fall as we anticipate,” said Wishart, “the house price correction is likely to be more severe and protracted, and take the total fall in prices closer to 20-30pc.”
However, the firm’s June report allowed us to breathe again. Their latest forecast is that inflation will ease, allowing interest rates to be cut from mid 2024 and limiting the total fall in house prices to around 12%.
Nevertheless, we’re far from out of the woods yet, and the impact of higher mortgage rates will be worst for those reaching the end of a fixed rate deal this year, who will feel similar pain to borrowers in the late 1980s.
One reason why the Bank is having to raise interest rates by more than anyone thought likely a year ago is that the group most affected by interest rate rises is relatively small.
With more and more moving to fixed mortgage rates or owning their homes outright while some homeowners will be hit hard by mortgage rises, others will sit out this interest rate cycle painlessly.
The most vulnerable group bought with two year fixed rate mortgages in 2021-22, but they only account for 20% of the 400,000 borrowers reaching the end of their fixed deals in each quarter over the next year.
These borrowers were stress tested against a mortgage rate of 6.6%, so may only just qualify for the current 2 year fixed rates of around 6.4% offered by major lenders. However, with real disposable income falling due to inflation and other factors, a large chunk of these borrowers may struggle with their new higher repayments. The Government’s new Mortgage Charter may help a little – for instance, for a borrower paying £670 a month on a 30 year term, coming to the end of a 2 year fix, going interest only would mean their monthly payment rises to £1,000 rather than £1,200. Extending to a 40 year term would bring payments to £1,100 a month.
Despite all this, some borrowers will still fall into arrears, but since only around 5% of borrowers are in the highest risk cohort and CE think unemployment will increase by less than in past recessions, they’re confident that repossessions will rise by much less than in the early 1990s and 2005-09.
Having said all this, Wishart admits that their assumptions are “coming under pressure”. The peak Bank Rate priced into financial markets is 6.5% – well above Capital Economics’ forecast of 5.25%. This would see mortgage rates exceed stress test levels – pushing more of the high risk cohort into arrears, and very likely causing a deeper recession than they forecast, leading to even more unemployment and homeowner arrears.
So what do we think? Conclusion
It’s hard to see past the November consensus of a 10-12% drop over two years. The factors looming at that time are still playing out and – barring any fresh catastrophes – will continue to do so.
Fewer homeowners are affected by high mortgage rates than were in 2008 but the longer they stay high, the more stress they will cause, and more things will break under the pressure.
However, as inflation eases, the more leeway the Bank will have to take its foot off homeowners’ throats.
But there’s still some way to go before we even reach that 10-12% mark – which, remember, only takes us back to the position we were in before the extraordinary and surprising growth of 2021. So all other things being equal, it’s hardly the catastrophe the headline writers want us to feel it is.
So what does all this mean for CapitalStackers investors in particular? Well, first and foremost in the current climate, being a secured lender in this asset class is arguably better than being an owner. That statement comes with caveats, of course. Sitting in higher layers in first loss position, especially when there is a third party senior lender, certainly warrants the higher pricing.
So, for now, we’re keeping calm and carrying on. Our modelling is now even more conservative, reflecting higher interest rates, increased contingencies, longer build periods and extended sales tails.
Having said all this…
The factors we’ve discussed can, and do, change on a daily basis. For example, the day after this piece was written, ONS statistics were released showing that inflation was slowing faster than expected (easing pressure for further rate rises) and there was also speculation that swap rates may be falling. And tomorrow may bring news that completely changes the landscape yet again. So we hope this piece serves as a snapshot, a pointer and a guide to see clearly through the kaleidoscope of headlines. And please be assured that even if you don’t have time to keep abreast of it all, we at CapitalStackers are keeping our finger on the pulse.
Don’t invest unless you’re prepared to lose all your money. This is a high risk investment. You may not be able to access your money easily and are unlikely to be protected if something goes wrong. Take 2 minutes to learn more.