Portfolio statistics
Here you can see the underlying information regarding deals that have been supported by CapitalStackers so far.
We work with banks to mitigate liquidity risk and make funding safer for you and the borrower. This collaborative arrangement brings all round mutual benefits, and also makes the process smoother and more efficient.
Loan data
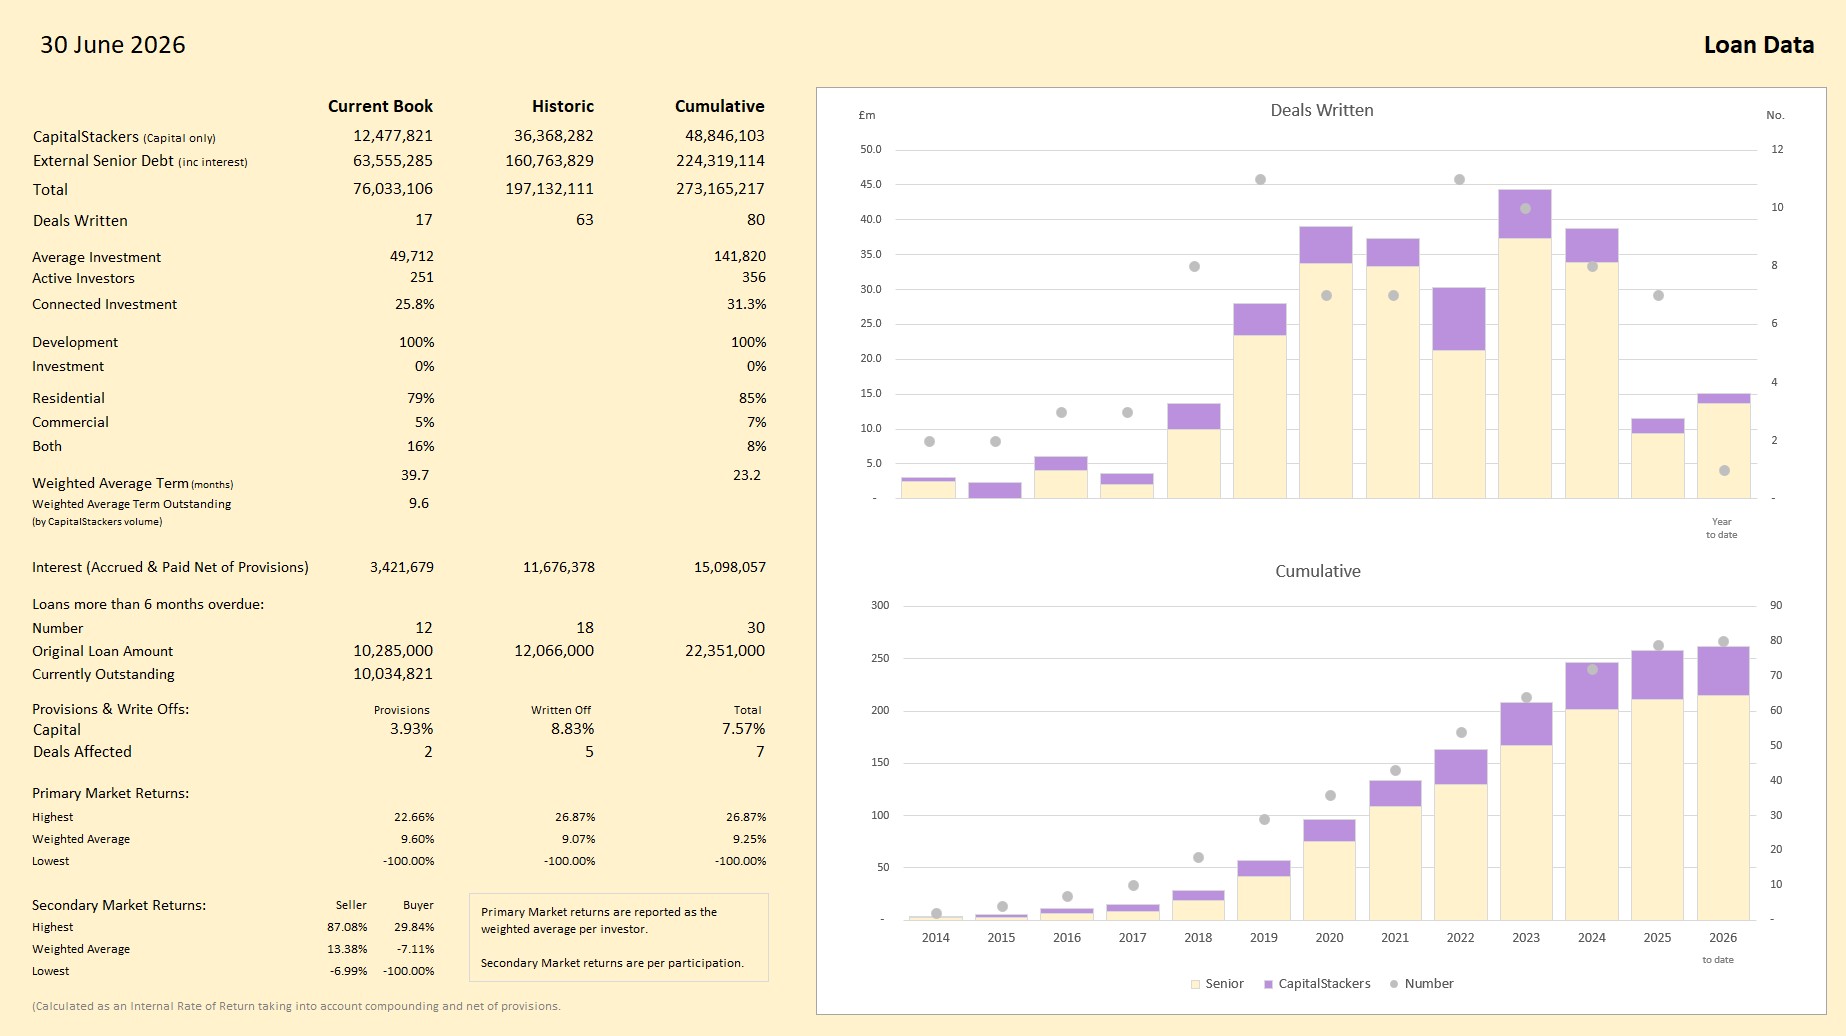
In the charts above, the purple sections represent cash provided by our investors, while the lighter areas show bank funding. Together, this combined debt finance allows developers to deliver projects that would otherwise never get off the ground. Our platform focuses primarily on the junior debt space. Junior debt goes in first and is repaid after the senior debt. Because repayment flows from the bottom up, we restrict access to the higher‑risk layers to investors best equipped to assess them.
At the top of every CapitalStackers web page you’ll see the FCA‑mandated warning: “Don’t invest unless you’re prepared to lose all your money…”. We choose to use this wording verbatim because it accurately reflects the risks inherent in the property lending junior debt space in which we operate. Some platforms are permitted to state that investors may “lose some of your money”, but that would not accurately describe our marketplace. In junior debt, total loss is possible and has occurred for some investors who concentrated their exposure. For this reason, we strongly recommend diversifying across multiple deals to reduce the risk of losing all your money.
Property lending - particularly development finance - is not risk‑free. Development projects carry construction and exit risks that can delay repayment, and it’s not unusual for deals to run past their documented expiry date. Nor is it unusual for individual CapitalStackers deals to represent a relatively large proportion of the overall loan book; our transactions tend to be fewer in number but larger in size.
It’s also important to understand that CapitalStackers is not a pooled lending platform. Provisions therefore apply only to specific loans with a risk of total loss, not across the portfolio.
The “Average Investment” figure reflects the appetite of some of our larger investors, which can mask the fact that many smaller investors participate at or just above our £500 secondary market minimum. “Connected Investment” represents the portion of lending provided by our directors and their close family. We invest in every scheme alongside you, and we believe it’s reassuring to know that we have genuine ‘skin in the game’.
What matters most, however, is how we monitor and manage loans that become impaired. Monitoring is our core competence - our home territory. While our record isn’t perfect, our provision and write‑off statistics demonstrate both our experience and our long‑standing ability to navigate difficult situations. These statistics reflect what many developers are currently facing: rising build costs, extended timelines, higher funding costs and slower sales - all of which can put downward pressure on values, extend repayment periods and increase the interest burden. Except in the most exceptional cases, this results in upward pressure on Loan‑to‑Value ratios and a need for more intensive performance monitoring. The FCA encourages us to report loans that are “6 months overdue”, and we comment further on this under Repayment Performance.
Regular readers will have noticed an increase in our provision ratios. As explained below, we have taken a more cautious stance on two of the four affected loans (with two loans relating to the same project, hence provisions shown against five). The circumstances behind these impairments are not typical and do not reflect the overall health of the remaining loan book:
- A multi-storey Permitted Development scheme in which the lower floors had been partially completed prior to our involvement (i.e. signed off by building control, the warranty provider and with some units already sold to leaseholders who had successfully raised mortgage finance). The legacy of Grenfell and the Building Safety Act then introduced a higher level of fire safety compliance. This resulted in invasive surveys identifying serious shortcomings and the need for remedial works to be carried out on all floors (including those previously signed off). Poor contractor performance, the need for a ‘waking watch’, huge cost overruns, extensive delays and ultimately the appointment of an Administrator by the senior lender have created the perfect storm adversely impacting all junior lenders. Needless to say, the lessons learned on this deal have been applied in spades to our other multi-storey developments.
- The redevelopment of apartments over a parade of shops was beset with construction delays and the eventual failure of the contractor resulting in the need to manage out the construction. These cost increases and delays were compounded by slow sales and a need to significantly discount prices. The borrower decided to sell out rapidly at the best price available, crystallise the loss and then come to an arrangement pursuant to his personal guarantee to make good the investor losses after the event from future cashflow. In the meantime, this loan has been fully provided for pending recoveries being generated over the coming months.
- Dire performance by a modular build factory and its associated contractor led to excessive delays with the delivery and commissioning of four townhouses. A total breakdown in relationship between the borrower and contractor ensued with the latter holding the former to ransom. Building Control sign off was eventually achieved by a replacement contractor (the funding of which was bridged by CapitalStackers) on a project which could and should have been delivered to market some 2 years earlier. This is a whole loan with no third party senior debt so the majority of investors will eventually be repaid and losses confined to the upper layers. The losses might be recovered subsequently through litigation and payment under the developer’s personal guarantee.
- A 63 unit PRS scheme in London suffered construction delays and cost overruns. However, whilst contributing to an increasing Loan to Value ratio, those issues were completely overshadowed by glacial performance at local authority level. We could, and should, have been out of this deal many months earlier were it not for entirely unnecessary delays in due diligence and final S106 negotiations. It truly beggars belief that during a housing crisis it can take so long to get the purchase of much needed homes across the line following the Council’s decision to buy in August 2024 and then over 12 months later reneging on the price they had previously agreed. The intervening period resulted in senior debt interest rollup devouring the developer’s equity and the price adjustment wiping out the junior debt.
A write off doesn’t necessarily mean there is no chance of subsequent recovery. In all circumstances we thoroughly investigate if and how loss can be mitigated. For example: (a) in the case of the multi-storey PD scheme, we tabled proposals to the senior lender and Administrator for the reconfiguration of the upper floors and addition of three new storeys; and, (b) we negotiated a recovery equating to 36% of the capital written off on the London PRS scheme in circumstances where the senior lender had incurred a loss net of any funds recoverable under directors' personal guarantees.
Repayment performance
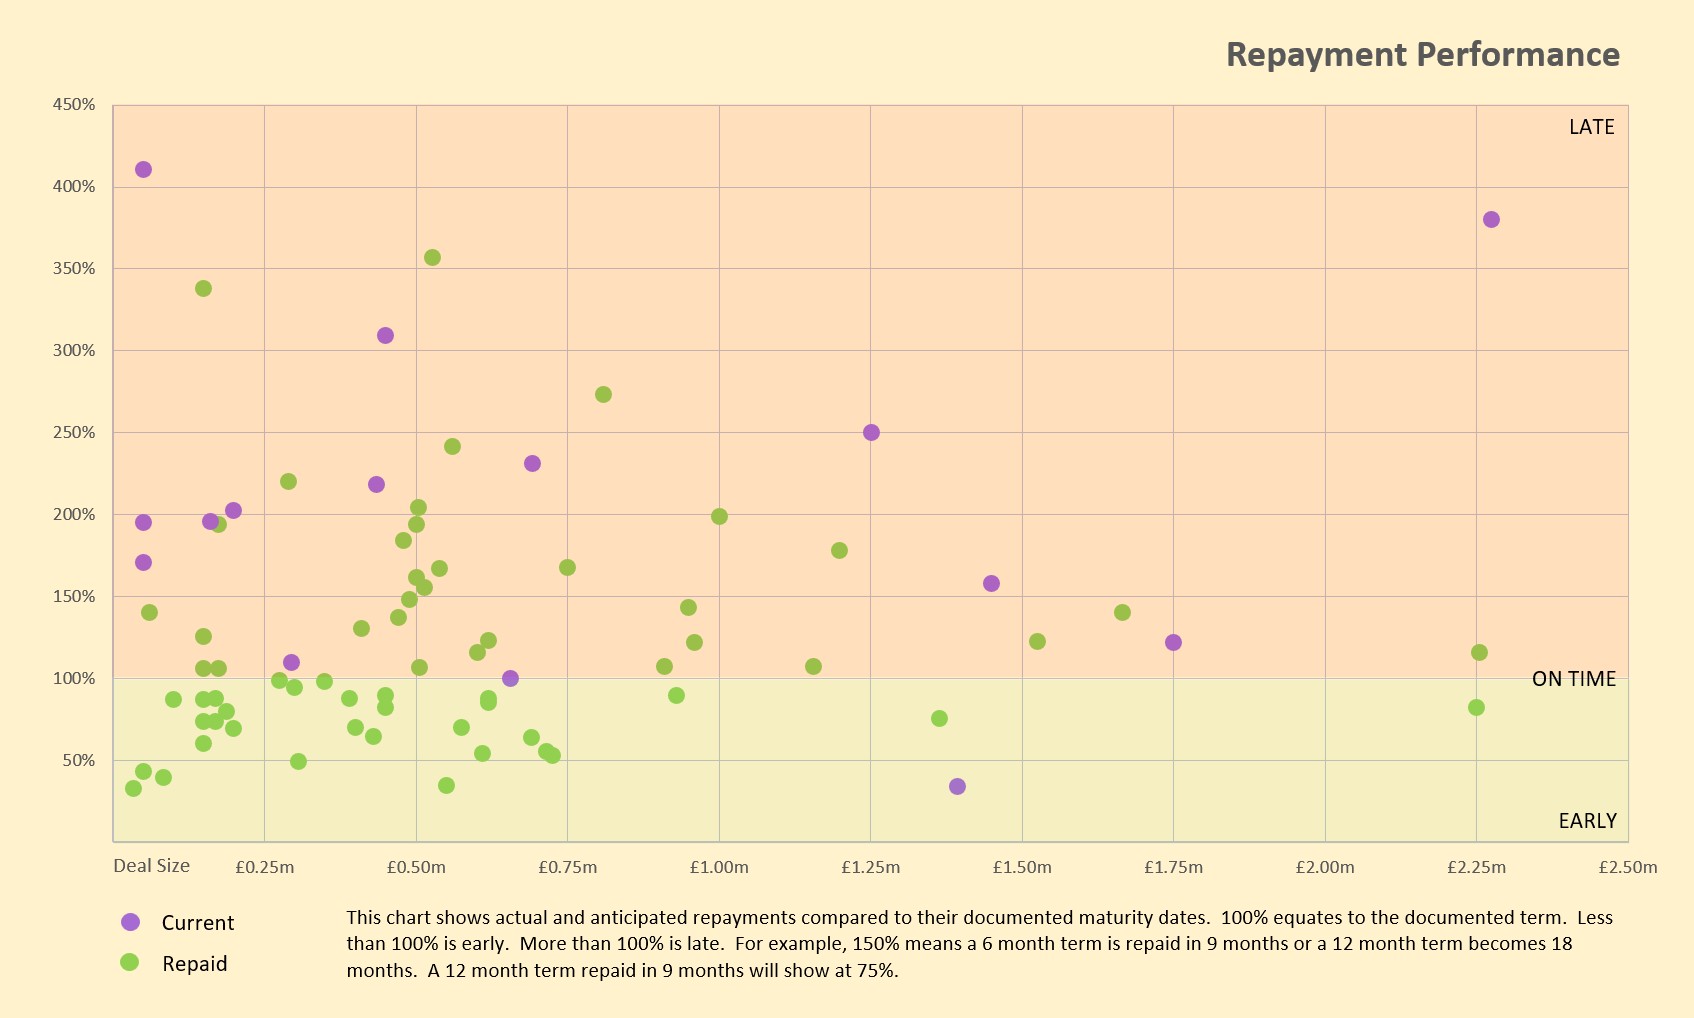
The above chart illustrates how setting the loan repayment term at the start of a deal is far from an exact science. However, it is a skill developed over decades in the industry, through all shades of the economic cycle. We could, of course, make these particular statistics look better by documenting a longer term at the outset or resetting the loan maturity at the end of the original term. Some funders do but we have no interest in compromising on the discipline and expectation management which is a visceral and integral part of this type of lending. When a deal goes way past its planned redemption date, we will understand the reasons why and when we continue to support the borrower it will be for sound business reasons, not least of which is the recognition that the insolvency process is a sure fire way of ramping up costs and destroying value. Far better outcomes can be achieved by working through problems with a cooperative borrower than through the appointment of an insolvency practitioner which should always be a last resort.
The following examples demonstrate what can go wrong and how that impacts on loan repayment:
- On a housing development the contractor (not the borrower) fell into financial difficulties leading to delays on site and ultimately went bust resulting in further delays before another contractor was appointed. Sales took longer than anticipated but the borrower’s management was keen to hold out for the prices they fully expected to achieve (and ultimately did). We were closely monitoring the entire situation in detail as it unfolded. Because some interim sales were completing and the risk ratios improving, we continued to support the developer and full repayment was achieved 14 months after the original 17 month term.
- A multi-storey apartment development was badly impacted by lockdown delays and cost overruns, and in particular an overseas lift manufacturer closing its factory. Then a further delay arose due to retrospective implementation of additional fire protection measures. A pre-sale negotiated during construction of the whole building to a housing association fell through, leaving the developer effectively having to market from scratch. The property was sold out and the loan fully repaid in January 2023.
- One delay related to the rump end of the first phase of a housing development which would have sold out and been repaid many months previously were it not for two successive purchasers failing to perform followed by the country going into lockdown and subsequent delay in the market opening back up again. The sale was eventually completed in July 2020, some 16 months late.
- Following construction delays, pre-sales on a multi-storey building were impacted by numerous mortgage offers having to be refreshed following the Q3 2022 interest rate hike. The loan is now fully repaid.
As illustrated by the chart, current economic headwinds and a tight labour market coupled with cost inflation and higher interest rates have resulted in longer delivery periods and extended sales periods which impact loan maturity.
Every deal is monitored meticulously by us on your behalf. We use independent monitoring surveyors on all developments and their reports and updated financial appraisals are continuously available in every deal Data Room so that there are never any surprises. In each of the above examples, at no point did we believe investors were at risk of losing capital or interest.
What about risk and reward?
The above overview of lending activity and loan performance is meaningless in the absence of a detailed insight into what return you can expect for the risk being taken. You will have seen on the Home page that the CapitalStackers’ model is all about plugging the real estate funding gap left behind when banks started lending less after the Global Financial Crisis. And that doesn’t mean only providing junior debt. We have also done a number of senior debt deals where the banking market hasn’t had either the time or capacity to get involved, and where we feel they may have missed a sound opportunity.
Our key measure of risk is the Loan to Value ratio (LTV). We have the ability to layer the capital stack and price the different risk bands accordingly. And because there are many other risk factors at play (in addition to the obvious market forces like supply and demand), the rewards on offer can be quite varied - as demonstrated in the following scatter chart. It shows the starting LTV and return of each layer in every deal and compares them against end LTV for repaid loans and current LTV on existing live loans:
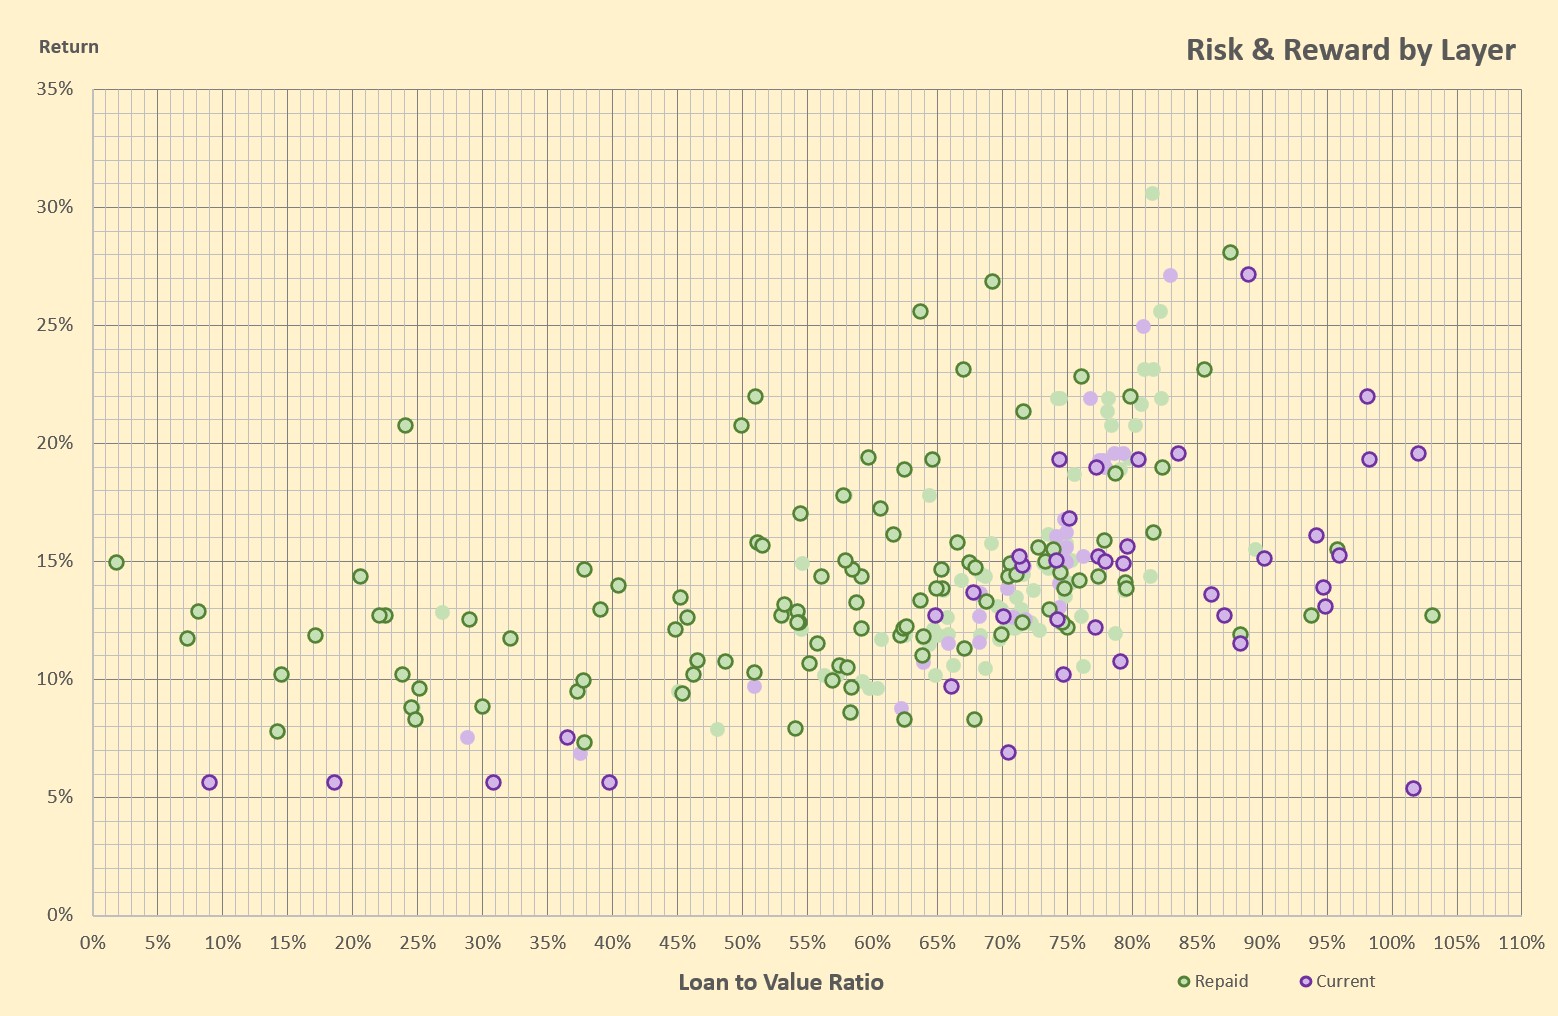
Green dots represent repaid deals and purple dots current live deals. Dots without a border represent the return secured in the Primary Market after bidding for a participation at the relative LTV ratio. This is an IRR (Internal Rate of Return) calculation which takes into account the compounding of interest and remains fixed for the duration of the deal. Dots with borders show the exit position for repaid deals and current LTV ratios for live deals. Deals suffering cost overruns and delays will likely see their LTV ratio drift out. In these circumstances, the return can look light in relation to the increased risk although in some circumstances that might be mitigated by default interest. Conversely, as partial repayments reduce the debt, the LTV ratio should improve through degearing. This is reflected in the raft of repaid dots where the return appears unusually high for the exit LTV – with their related Primary Market bids showing somewhere well to the right in the chart. It’s also worth noting that these returns are calculated as the weighted average which disguises the fact that the spread between individual bids within a layer can be quite wide.
Senior and low LTV junior loan returns will typically be single digit, whilst higher LTV junior loans are double digit in the mid to high teens and occasionally in the twenties.
Standard investments in the Primary Market are now capped at 75% LTV. However, we have enabled higher LTV deals using ‘Underwriter’ funding which typically caps out around 80% LTV (but sometimes higher). Underwriters are HNW, Sophisticated and experienced investors and sometimes introduced by the borrower. As highlighted in the chart, the majority of what we do is concentrated in the 60-75% LTV range generating on average low to mid teen returns.
These statistics do not include Secondary Market returns, where it is possible for existing investors to generate higher returns by selling loan parts at a premium on deals where the risk profile has improved. Conversely, loans can be sold at a discount to current value where the risk has deteriorated or an investor is looking for a quick sale.
The market and sentiment have been impacted by high inflation and interest rates which not only make development more expensive but dampen demand so it takes longer to sell the finished product. Couple these factors with higher project costs and the starting LTV ratio is pushed out, sometimes considerably - as shown in the higher LTV exposures above. As a matter of policy, we regularly review loan performance and extend cashflow periods where sales are anticipated to take longer and include the increased cost of borrowing in our LTV calculations. It should always be borne in mind that in the junior debt space and especially the higher layers, there is a real risk of total loss. Diversification is key to mitigating this risk.
If you want to know more about how we report these statistics, just call us on the number below.
We’ll be happy to talk you through them.
0161 979 0812
Past performance is not an indicator of future results