6 December 2022
Or Did Liz Truss Break the Crystal Ball?
Here we go again! Or do we?
After years of warnings that the property market was overvalued, we appear to be peeking over the top of the rollercoaster. But the speed and depth of the descent we face depends on whom you listen to, and which cross winds and loose bolts you pay most attention to.
According to Nationwide [1], following 15 consecutive months of growth, average house prices, having gone up 0.2% In July [2], 0.8% in August, and remaining static in September, then finally turned, dropping by 0.9% in October and 1.4% in November [3] – thanks largely, they said to the ‘Fiscal Event’ precipitated by Mr. Kwarteng (remember him?) just before he fell out of a window himself. This brought the UK average house price down to £263,788, from a peak of £273,751 in August [4].
Our last report in April now feels like it was written a century ago, on a different planet. This review is intended to be a regular round up and analysis of the more sensible property predictors – who’s saying what, why they’re saying it and what evidence they have to back it up.
However, there’s been so much egg flying around in the last few months that it’s proved virtually impossible for any property analysts to avoid getting yolk on their faces. Trying to predict the events of 2022 based on past history is a bit like trying to count strawberries in a blender. Neither Mr. Putin’s ongoing colonial ambitions, nor the astonishing Ukrainian fightback could have been foreseen or priced into the property market while we were all locked down in 2021, watching property values unaccountably continue to climb. Canny observers might have forecast that the West’s dependence on Russian oil and gas would end in tears, but would probably have stopped short of the nightmare scenario of a fossil-fuelled global recession.
Nor could anyone have predicted the financial chaos of the last two months – the ‘KamiKwazi budget’, then its total reversal, four chancellors in twelve weeks and an antibudget that brought about the most savage tax squeeze in decades. It also caused mayhem in the financial markets, sent Government borrowing costs rocketing, and, of course, triggered higher borrowing costs which will have to be repaid when household finances are already under pressure from energy bills, inflation and…well, the general cost of living crisis.
(The “Fiscal Event”, we hardly need remind you, was a name intended make it sound less serious than a budget, but ended up making it sound as serious as an earthquake. It also distracted economists from the global causes of what was happening in the economy.)
So predictors have had the Devil’s own job of making sense of an economic backdrop which in itself makes no sense.
And of course, those predictions varied wildly. Depending on what page you open the newspaper at, house prices have been ‘soaring’, or crashing, or unsustainably high, or flat. They can’t all be right, can they? Well, they can – mostly. But only if you’re clear about what you’re looking at.
That’s because all those predictors are telling us different things, and are correct from different perspectives. So let us do our best to make sense of them all. Just to prepare you, this will be a long read, but worth it, we hope – and we’ll do our best to keep it light and easy to follow.
How reliable are the figures we read?
The main voices we listen to in the UK are:
- Halifax, which publishes house price reports every month based on the purchase prices of transactions it has financed.
- Nationwide, which uses data from mortgages it has approved to estimate the typical cost of a house.
Both the above are the country’s biggest lenders, and they give us a pretty up-to date snapshot of what’s happening, but since they only use their own mortgage approval data – and they completely overlook cash transactions (a third of the market) – the picture they give us can be incomplete.
To give you an example: Halifax told us that in October [5], average house prices fell by 0.4% to £292,598. Nationwide, on the other hand [6], reported a much steeper fall of 0.9%, but said the average house price was £268,282 – a difference of over 24 grand! (Halifax’s December HPI was not available at the time of publication)
So to get a more holistic view, we also look at:
- Rightmove, the UK’s biggest property sale portal which uses the house prices shown on the site. It’s as fast with the figures as Halifax and Nationwide, and having a much larger sample size than either of them, it gives a bigger picture, since it’s not based on the transactions of a single business.
However, since Rightmove’s report is calculated on the prices listed on the site [7], it’s actually an Asking Price Index, rather than a measure of the change in actual sale values. So then we also need to look through the prism of:
- The ONS. The ‘official’ statistics – taken from HM Land Registry, Registers of Scotland, and Land and Property Services Northern Ireland, which shows actual changes in ownership. However, because these take a while to come through, they’re always a couple of months behind. But to give you an idea of how their numbers compare to the lender data, the ONS told us the average house price in September was £295,000 [8], compared with Nationwide’s September estimate of £272,259 [9], and Halifax’s of £293,664 [10].
- The UK HPI. The new index on the block, having been around just a couple of years, is the most comprehensive and reliable index there is. It’s based on actual transaction data from HM Land Registry, Registers of Scotland, Land and Property Services Northern Ireland and official mortgage and Council Tax data (to analyse buyer types) – but like ONS, it suffers from data lag. Also, we can’t currently compare past and present figures because methodology changed over the Covid period to account for the fact that the processing of new build properties has been more affected than the processing of “old build” properties.
- The OBR. The Office for Budget Responsibility produces a short-term forecast for the current and next quarter. This is based on such indicators as survey data from Royal Institution of Chartered Surveyors and GfK, and mortgage lending data from the Bank of England. The two variables they consider most important in fiscal forecasts are: house prices, as measured by the ONS house price index [11], and the number of transactions reported by HMRC [12]. Multiplying these figures together (i.e. transactions x the average price) gives them the (aggregate) average value of property transactions.
- Zoopla. This property sale website uses HM Land Registry, Registers of Scotland, official survey records, Royal Mail and Ordnance Survey as well as their own listings to predict.
- LDL Acadata. Also based on the Land Registry, but because they only cover England and Wales, they turn around a bit faster than UK HPI
- Savills. Like Halifax and Nationwide, this global estate agent uses a combination of its own data, official figures, the data analysts Oxford Economics and historic patterns to predict future trends.
These, we stress, are only the main voices in the Babel of property prices. And, in the main, they’re our rear-view mirror. Apart from the OBR, they tend not to give official forecasts. Other voices in the mix (who do forecast) include Lloyds Banking Group, the Royal Institute of Chartered Surveyors and various academics, housebuilders and estate agents (most notably Savills). And, of course, the author and economist Fred Harrison – who gained a lot of attention for correctly predicting the property price peaks in 1989 and 2007, the ensuing slumps, and a 10% rise in UK house prices over the UK Pandemic. Mr. Harrison maintains that the property market works on a cycle of 14 years growth and four years of falling, and that prices will continue to grow until 2026, when they’ll drop 20%. So far, he hasn’t changed his tune.
So where are we now – in actual numbers?
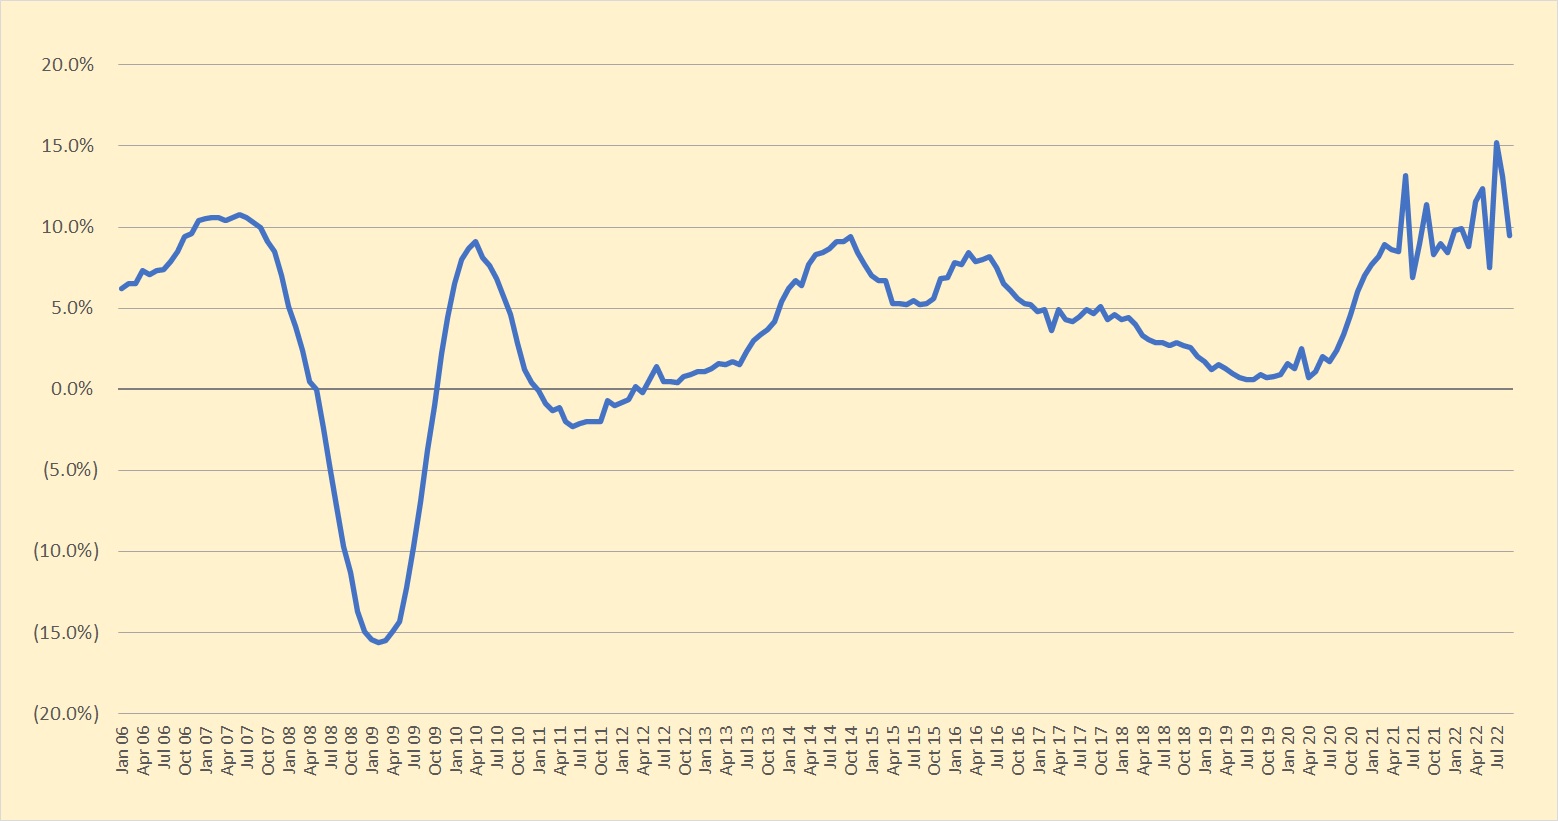
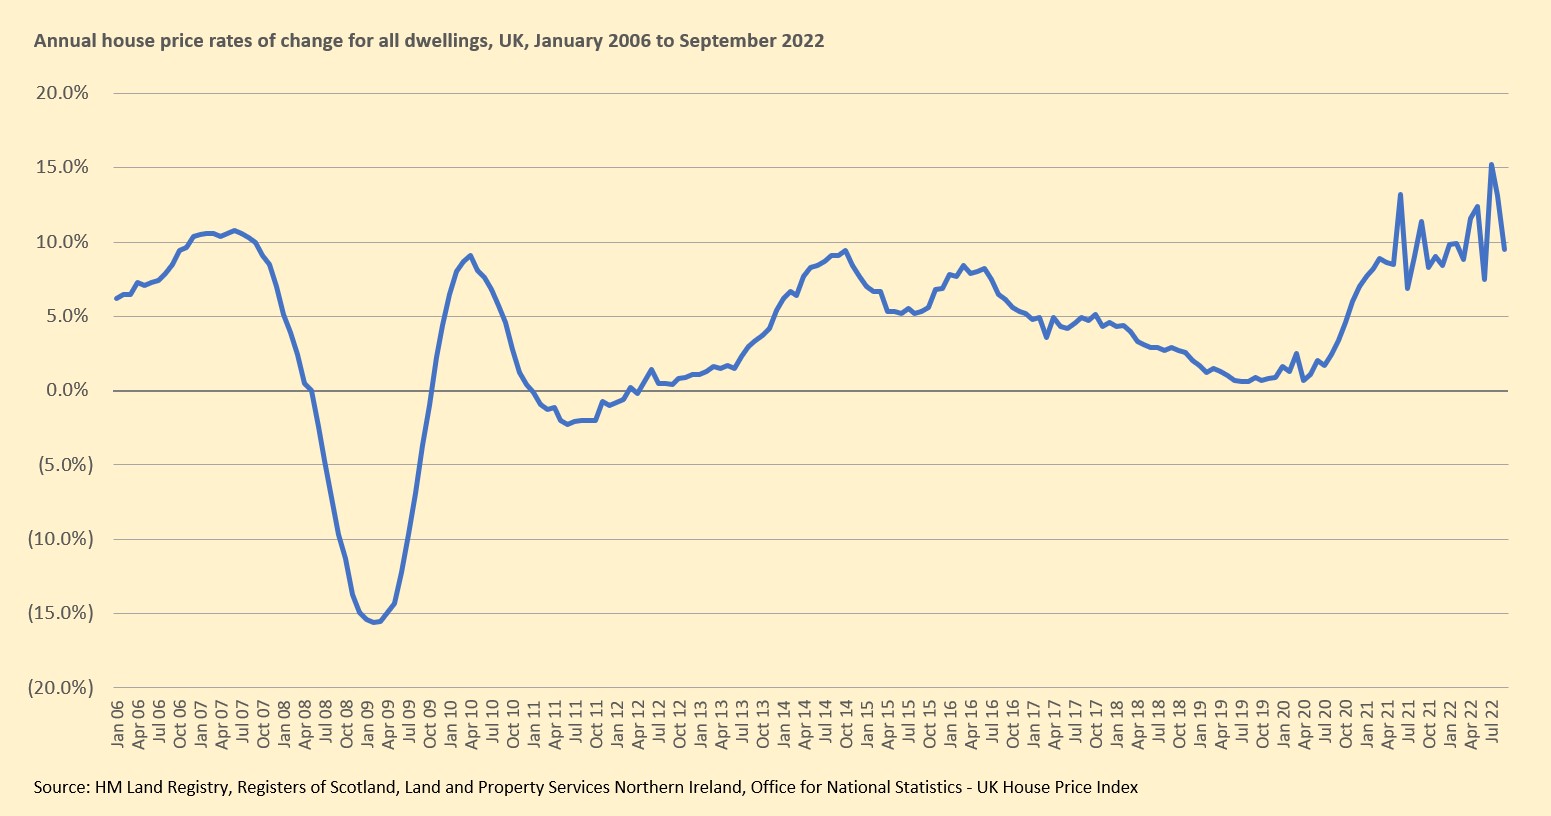
The HPI tells us [13] that UK average house prices increased by 9.5% over the year to September 2022, down from 13.1% in August 2022 (remember, HPI figures come two months in arrears, so we won’t see what happened in October till Mid December). The YOY percentage change was lower in September 2022 because UK house prices rose sharply in September 2021, due to the rush to beat the end of the Stamp Duty Land Tax holiday. UK house prices remained unchanged between August and September 2022; this also caused the annual percentage change to slow.
The average UK house price was £295,000 in September 2022, which is £26,000 higher than this time last year, and unchanged since August 2022. Broken down by country, the average house price increased over the year to £314,000 (9.6%) in England, to £224,000 in Wales (12.9%), to £192,000 in Scotland (7.3%) and to £176,000 in Northern Ireland (10.7%). Of course, this historic upward trajectory disguises the fact that prices are now actually falling following the upheaval discussed above.
How is Jeremy Hunt’s budget expected to settle the turmoil?
Mr. Hunt (presumably with Mr. Sunak pulling the strings) did his best to calm the market jitters after the “fiscal event” (and fill the £55 billion hole in the Government’s finances) in mid-November. He explained that just under half of the £55 billion will come from tax rises, with the remainder coming from cuts to government spending. His key actions were:
- Stamp duty cuts to be reversed in April 2025
- Energy price cap, raised to £3,000, to stay in place for a further 12 months from April
- Councils given the power to increase council tax
- Capital gains tax threshold reduced to £6,000
- Inheritance tax threshold frozen at £325,000
These measures, said the OBR, will lead to a shallower downturn. They forecast that the economy will grow by 3.8% this year [14], before contracting by 1.8% in 2023, with growth recovering to 2.1% in 2024. Meanwhile, inflation will rise from 7% and peak at 11% this year [15], before starting a steep slide back to below 2% from the middle of next year. They expect unemployment to rise [16] from the current 3.9% to 4.2% in 2024, before falling back to 4.1%. Not exactly a rosy picture in the short term, but better than it looked in October.
And where will that leave the housing market?
Well, to cut to the chase, over the past few helter-skelter weeks, predictions have hurtled between prices plummeting 20% or more to just remaining static. As Tanja Toumadj, of Mortgage Broker Tools (MDT) [17] summarised in September “Experts across the market are predicting house price falls over the next two years, with Capital Economics suggesting as much as a 12 per cent drop in London, and some reports of down valuations emerging already as a result.
“However, there are contradicting reports that a downturn in the housing market will further reduce supply, which will help to underpin prices.”
But following Mr. Hunt’s “Steady Hand” budget, the OBR has settled on a 9% drop [18]. Which, given that they take their data from the ONS, who take their data from the Land Registry, who reported that house prices rose by 9.5% year-on-year [19] in September means that we’ll only lose the growth from this year – in fact we’ll be up half a per cent from last year. And given that most commentators felt that the growth throughout the pandemic was excessive, overpriced and well overdue for a caning, this feels like a win after a rollercoaster ride.
But it should be borne in mind that this jump from twelve months ago reflects the distortion in the property market following the end of the stamp duty holiday last summer, when there was a rush to buy in June 2021 to cash in on the tax savings, which caused an unnatural lull in July and August. Also, (as we mentioned above) these data relate to purchases added to the Land Registry in August, so they’re probably referring to sales agreed back in May or June – when the market was in a very different mood.
Having said all the above – anyone who can look at the graph below and still tell you with a straight face they could have predicted its movements should be put under immediate sedation.
How do these figures break down regionally?
As always, the growth is not evenly spread. According to Halifax, the main driver of house price inflation in 2022 [20] was an intensified demand for urban homes. House prices in major cities grew by 9.2% up to September this year, compared to 7.9% in the suburbs.
There was significant variation across individual cities, but overall the data depicted a post-pandemic retrenching of buyers’ tastes. During lockdown, the trend moved towards rural and more spacious properties, driving up prices up in non-urban areas.
Now that people are largely returning to the office – LinkedIn reported that remote jobs declined for the fifth straight month in September [21]– urban convenience is the primary driver and central locations are set to climb in value again.
Andrew Asaam, mortgages director at Halifax, said: “The pandemic transformed the UK housing market. Homeowners wanted bigger homes and better access to green spaces, fuelling huge demand for larger properties away from urban centres. This accelerated house price growth in the suburbs and more rural areas, while in cities it was much slower.
“That trend didn’t disappear completely this year, as house price growth in these areas remained strong. But, as daily life started to get back to normal for many, the opportunity to live in cities became more attractive again, driving up demand. There’s evidence of this in locations across the country, with property price inflation in the majority of cities outstripping increases in their surrounding areas.”
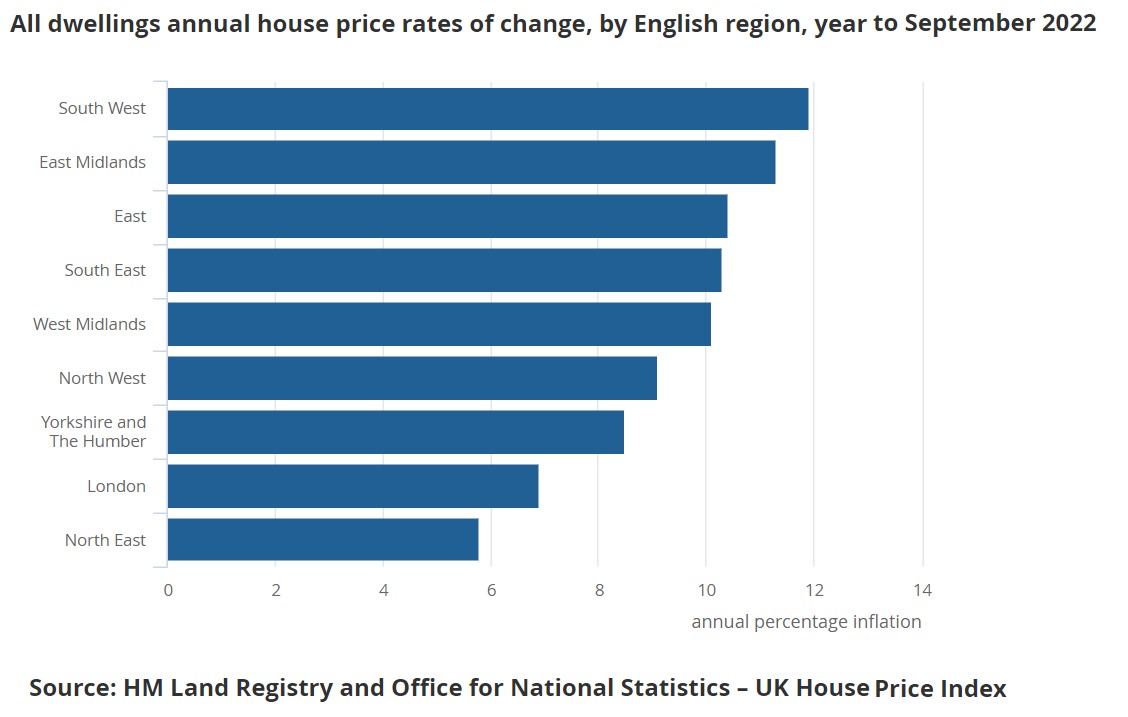
However, prices are certainly slowing in London. According to the latest HPI (figures to September, remember, but released in November), the annual percentage change to September dropping to 6.9% (having been 7.9% in April).
The South West, although the rate is falling, was still the region with the highest annual house price inflation – average prices increasing by 11.9% in the year to September 2022 – down from an annual percentage change of 16.8% in August 2022.
Growth in the North West slowed from 13.3% to 9.1%, but the North East replaced London as the region with the lowest annual percentage change, with average prices increasing by only 5.8% over the year to September 2022, down from 13.5% the previous month.
However, due to the extraordinary times, these short term changes cannot reliably be compared. The base effect reduced annual percentage change in the North East in September 2022, because average house prices rose sharply in the North East in September 2021, due to changes in Stamp Duty Land Tax. Since SDLT didn’t have as dramatic an effect on house prices in London in September 2021, London’s annual percentage change was not affected to the same extent.
So how are the more up to date indicators looking?
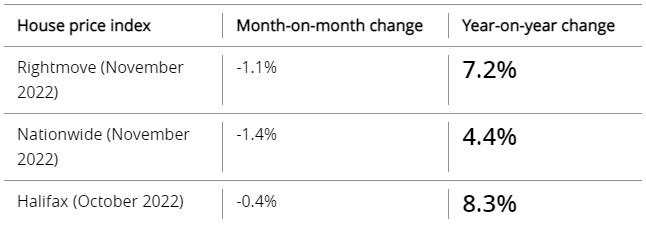
Well, Rightmove, Nationwide and Halifax all show considerably lower price growth than the Land Registry:
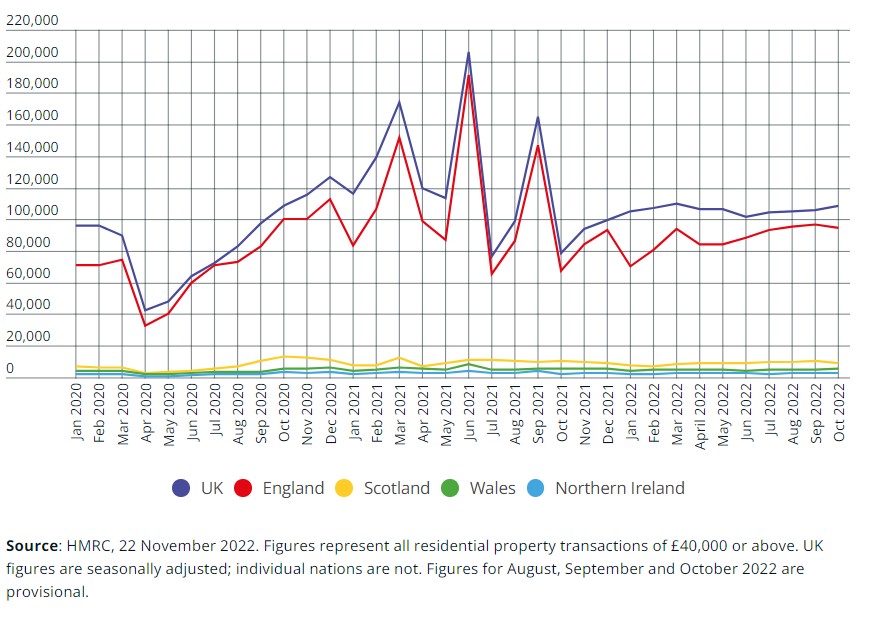
As for the number of transactions, we’re now back to where we were before the pandemic, with HMRC reporting 103,930 homes changing hands in September [22] – and while this represents a year-on-year drop of 36.8%, sales in September 2021 were unusually high due to the end of the stamp duty holiday, and the October figures were correspondingly low, at a seasonally-adjusted 108,480 [23] (29% higher YOY). Meanwhile, the time a house takes to sell is back up to 40 days and climbing [24], after a low of 31 days in April 2022
Sales recorded across the UK since the start of 2020.
Affordability, confidence and the mortgage market
So all this has laid bare a marked change of consumer mood. Until recently, the market was defined by a shortage of houses for sale [25] compared with the demand from buyers. However, the runes are showing that demand has started to fall. According to Rightmove, properties took an average of 37 days to sell in September, five days more than in May. Meanwhile, developers are making alarming noises that demand has halved [26] in recent weeks.
Of course, property price growth also depends on affordability and mortgage availability – which have both taken a panning from the mini-budget, coming as it did on top of soaring prices and slower wage growth. The uncertainty led to lenders withdrawing a total 1,500 mortgage products [27] from the market of deals and mortgage rates, with the rates rising from a historic low of 0.1% a year ago to a fourteen-year high of over 6% [28] – smashing through the OBR’s predicted peak [29] – before starting the long crawl back down again.
At the 6% rate, a two-year fixed rate mortgage for £200,000, with a 10% deposit, could cost buyers a painful £1,290 a month – 43% higher than in November 2021, when it was closer to £900 a month.
Mortgage approvals, meanwhile, fell to their lowest level since June 2020, according to the Bank of England’s latest figures [30].
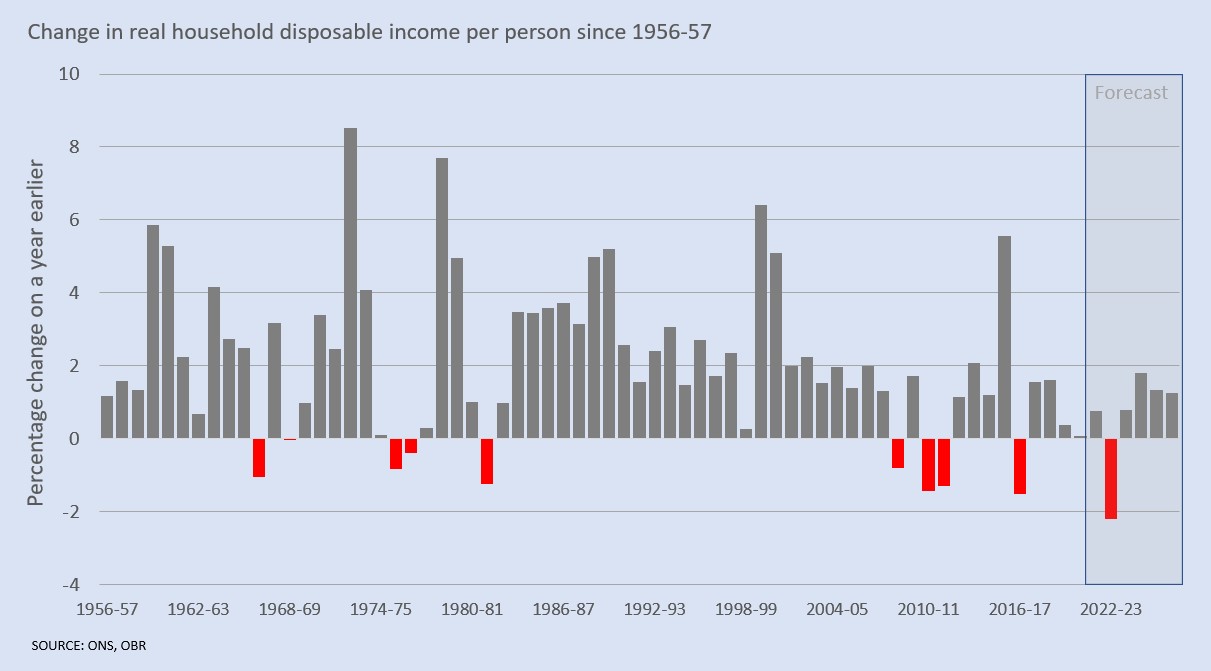
And with the Bank of England increasing the base rate to 3% [31], this trend could continue to push ownership out of reach for many people, and make life difficult for current homeowners as disposable income tumbles [32]. Buyers need to stump up a 40% deposit [33] before they can access the best fixed rates – and even these are hovering at around 5% – and up-front fees can be as high as £2,000.
Household disposable income, %age annual change.
This has dented confidence as much as it has wallets. PwC’s quarterly survey [34], which asks consumers whether they expect to be better or worse off in the next year, was buoyant just over a year ago, in those heady post-lockdown days. Since the spring, those sentiments dropped through the floor, although the decline shows signs of slowing. Unusually, this latest survey shows that drop in sentiment has become consistent “across every age group, socioeconomic group, nation and region of the UK” – including the usually well insulated, mortgage free middle class consumers: purchasing sentiment among ABs has tumbled terrifyingly from net +23 to -33.
Affordability, as reported in Nationwide’s 2022 report [35] was becoming ‘stretched’ everywhere the UK, even before the recent rate rises – although the level varies considerably by region, says Robert Gardner, Nationwide’s Chief Economist:
“To explore how this is impacting potential buyers we used regional income data to calculate where in the income distribution a prospective purchaser would sit if they were purchasing the typical first time buyer property in each region, with a 20% deposit and borrowing four times their income. If the typical buyer is located higher in the income distribution it suggests affordability is more stretched, with more people priced out of the market.
“In broad terms, the picture that emerges is that this hypothetical typical buyer is located further up the income spectrum as you go from the north to south of the country.
“For example, in Scotland and the North of England, this typical buyer would be in the 30th income percentile, while in the South West they would be in the 80th percentile, and above the 90th percentile in London and the South East.
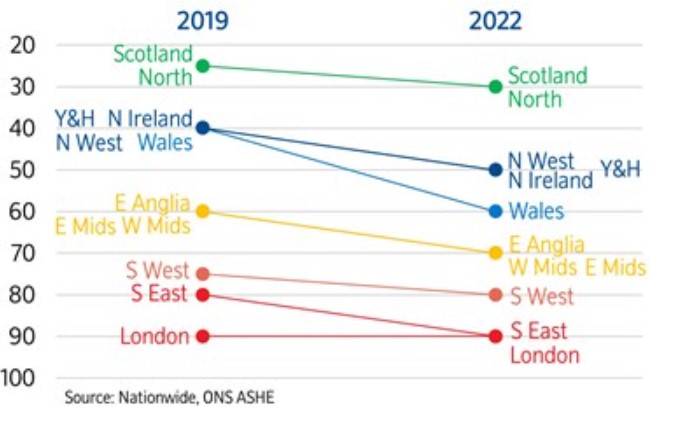
“As shown in the chart below, some regions have seen a more pronounced deterioration in affordability in recent years than others. In Scotland and the North region, the typical buyer is now located in the 30th percentile, compared with the 25th percentile in 2019, before the pandemic struck. Similarly, in East Anglia, East Midlands and West Midlands, the typical buyer has moved from the 60th percentile to the 70th percentile.
“A higher income percentile signals that a larger proportion of people are priced out of the market or needing to borrow a greater income multiple to buy a home.
How the typical buyer’s income percentile has changed
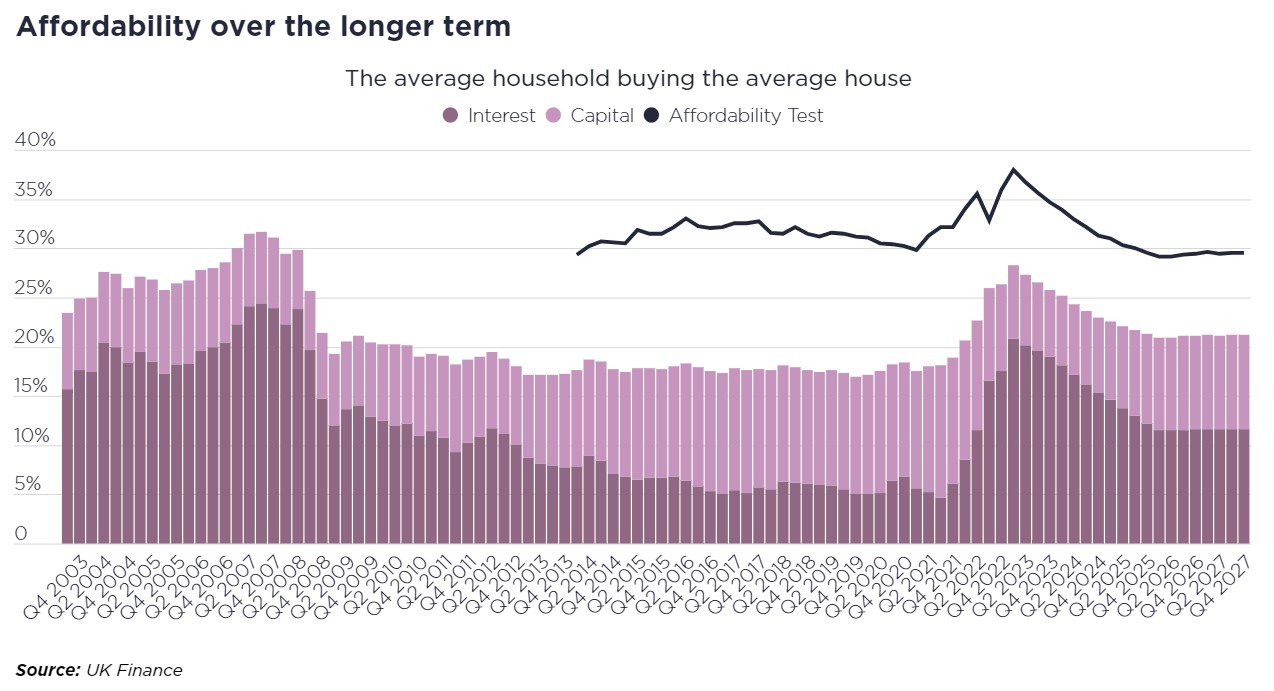
Halifax’s most recent House Price Earnings Ratio hit a record 7.1% [36] in the first quarter of this year – when the average mortgage rate was just 1.6% [37]. Even then, Lloyds voiced concerns that property prices were at their “least affordable” level ever. However, they mitigated this concern with the observation (also made in the last CapitalStackers white paper) that many mortgage applicants tend to do so jointly with a partner, which effectively doubles buying power.
Savills tells us that monthly mortgage payments reached 26% of income in September [38], with the average mortgage rate at 4.2%. While this was below the levels seen before the downturns of the early 1990s and 2007, it was a considerable jump from the 17% of the early pandemic, and gave those buyers thinking of coming forward a jab on the nose.
However, they also expect affordability to ease going into next year.
Of course, the market goes nowhere without first-time buyers, and at a national level, the first-time buyer house price ratio [39] is 5.6 times average earnings, compared with 8.5 for those moving home. Nevertheless, this market proved surprisingly resilient in the face of rapid price rises during the pandemic, raising the bar on saving for a deposit – a phenomenon Lloyds also puts down to the rise in dual-income applications, as well as an increase in mean first-time buyer age (now 32 years old – three years older than a decade ago), the likelihood that they’ll be more established in work, with higher earnings, and possibly still able to access the Bank of Mum and Dad. Behind this statistic, however, hides the uncomfortable fact that there’s been a 38% fall in homeowners aged 16-34 since 2000 [40]. This happens to be the same time period that the number of adults owning multiple properties in the UK increased by 147%.
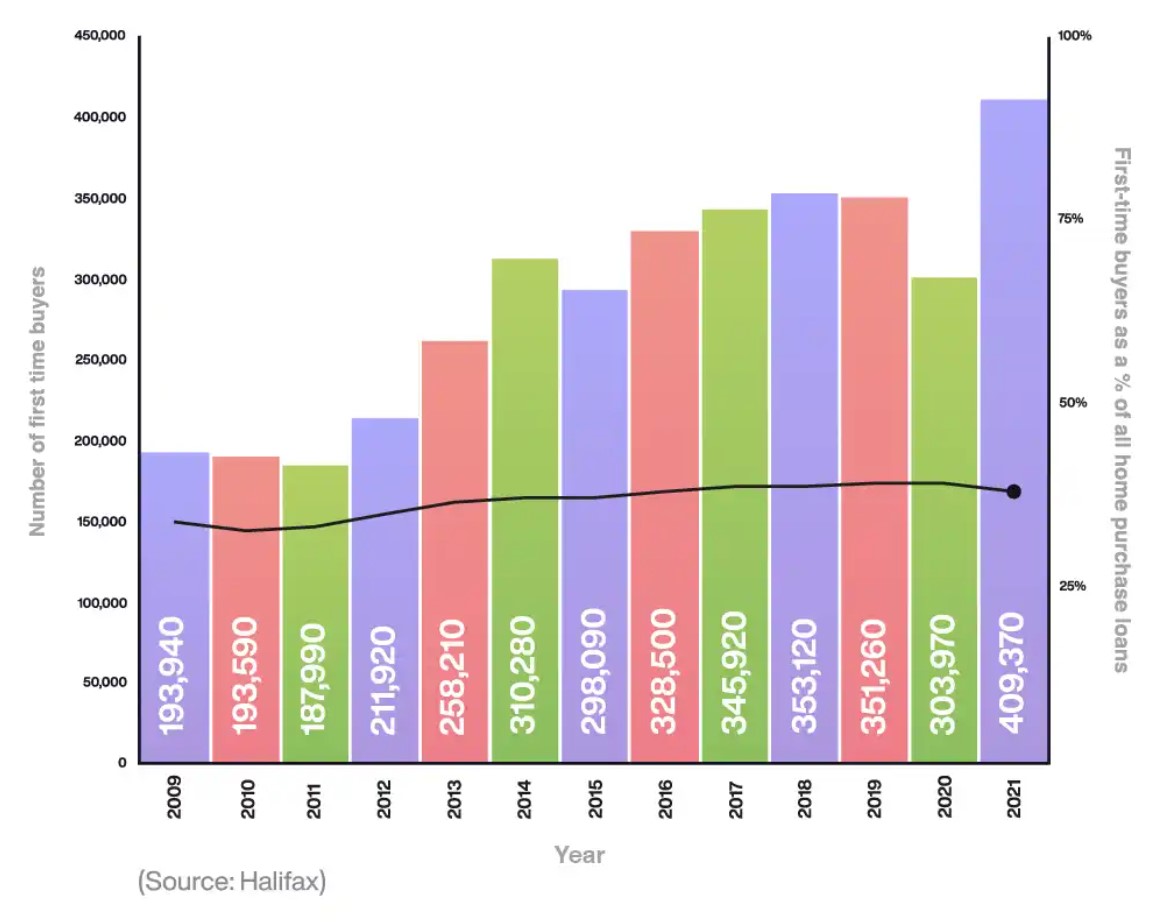
Nevertheless, the number of first-time buyer mortgages [41] in the UK has been climbing steadily since 2009, from roughly 194,000 to nearly 410,000 in 2021 – with an understandable dip to just under 304,000 during Covid-confounded 2020 – a time of generally low mortgage applications across the country.
The percentage of UK home loans granted to first time buyers among all has also risen steadily. In 2010, 37% of all UK home buyers were first timers, rising to a peak of 51% in 2019. This figure has now settled at around 50%, which of course means half of UK residents buying a home today are FTBs.
A breakdown of first-time buyers as a percentage of all house purchase loans
The recent scrapping of the Mortgage Affordability Test [42] may help ease more first time buyers onto the ladder – however, other affordability measures remain in place, such as the Loan-to-Income flow limit and other affordability assessments demanded by the FCA’s Mortgage Conduct of Business (MCOB) responsible lending rules; so it’s hardly likely to trigger a lending free-for-all, especially at a time of acute caution among the lenders themselves.
Still, like crocuses forcing their way through frozen ground, the market stasis has begun to stimulate lenders back into life, with the long awaited return of tracker mortgages [43] – the cheapest of which have fallen to just over 3%, and look increasingly attractive [44] to borrowers as the interest rates fall over the next year. Yorkshire Building Society’s two year tracker is down from 4.15% to just 3.29%, while Skipton has a two-year tracker deal at 3.39pc – both a lot cheaper than the average two-year tracker rate of 4.29%.
David Hollingworth, of mortgage broker L&C, said [45]: “It’s easier for lenders to be competitive on their tracker deals because it is pegged to the Bank Rate, so there is a clear margin and they do not need to hedge their pricing in the same way as a fixed rate.”
The best deals remain hard to find, though, even for those buyers using a broker. According to MBT, only 58 per cent of brokers search outside of the top 10 lenders [46] – and yet in 73 per cent of cases, the most affordable lender falls outside the top 10.
Will a glut of ‘distressed’ sales drag prices down?
Savills thinks not [47]. They feel banks and building societies still bear scar tissue from the widespread repossessions of the 1990s, and are thus likely to show ‘a degree of forbearance’ instead offering mortgage holidays or extending repayment terms until interest rates settle down again. This, they suggest, will result in ‘a trickle’ of forced sales, rather than a torrent.
However, some commentators raised concerns that a slew of buy-to-let properties will hit the market as landlords rush to sell before the tax-exempt allowance on capital gains is reduced [48]. The change will force anyone selling property that’s not their main residence to pay thousands of pounds in extra tax on their profits. Still, this will only affect those who had been planning to sell in the short term, so it’s again unlikely to lead to a flood.
So what are the commentators predicting (and how well have they done so far)?
Here we summarise what the market voices said in our last report and what they’re saying now.
Knight Frank
THEN: Knight Frank were way out. They predicted a 7% drop in house prices throughout 2021 (they rose by 10.8%) and a 5% rise [49] in 2022. Strength of demand, they said in April 2022, was “unwavering for now”, but borrowing costs may put a “dab on the brakes” later in the year, and inflation (then predicted to hit 7%) would “both put a direct drag on house prices and increase pressure on the Bank of England to raise interest rates”. In June, they upgraded their forecast to 8% [50], still short of the actual growth figure – and this, of course, was before the Kwarteng budget.
They also said “there is more risk on a two year horizon than there is on a five or ten year one, meaning the market thinks the next two years will be very unpredictable”. But their overall prediction was that that housing would “somewhat counter intuitively for the second year running, have a strong 12 months”. Which it did.
NOW: The estate agency forecasts prices will drop by 5% in 2023 [51], and a similar amount in 2024.
Capital Economics
THEN: Using mortgage rates as a predictor, forecast that prices would rise in 2021 (although only half as high as they did), and would drop by 5% over 2023-24, because the cost of borrowing would squeeze people’s ability to make ever-higher bids.
However, they also said: “We are not expecting a repeat of either 2008 or 1990, when house prices fell by about 20pc. First, while the house price to earnings ratio is roughly the same now as in 2007 we do not anticipate a return to pre-financial crisis mortgage rates of 6pc, so the cost of mortgage repayments will remain much less of a burden.
“Second, strong pay growth means a modest fall in prices will be enough to return the house price to earnings ratio to a more sustainable level.”
NOW: Given that we have indeed seen mortgage rates breach 6% and wage growth is also at 6% [52], it’s anybody’s guess where things go from here – but Capital Economics’ guess is a 12% total drop by mid-2024 [53].
Lloyds
THEN: Predicted a 5-10% drop for 2022, later revised to a rise of “around 1%”. So only 8.5% out. Maybe they got the horse to do the predictions.
NOW: Base case scenario, say Lloyds, is that house prices “may fall by 8% in 2023, with a peak-to-trough fall of 10%” [54].
Its “Severe Downside” (worst case) scenario is that prices may fall by as much as 17.9% in the same timescale – however, this factored in interest rates of 7% and inflation at 14%. Now that steady Mr. Sunak is at the helm, they say, “this cliff-edge scenario feels very remote”. As the UK’s largest mortgage lender, Lloyds has put aside £688 million [55] as a buffer for loan defaults.
Zoopla
THEN: Zoopla got it half right (sort of). They predicted a 5% rise in 2022 (which is just over half the actual rise), with steadier 3% growth in London.
NOW: Richard Donnell, executive director at Zoopla, said: “The most likely outcome for 2023 is that we see a fall in mortgage rates towards 4% with a modest decline in house prices of up to 5%.” [56]
Despite lagging demand, the housing market is on track for around 1.3 million sales in 2022, Zoopla predicts.
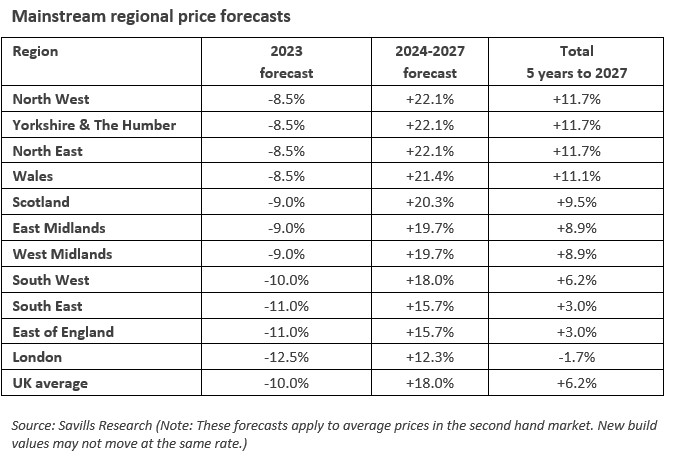
Savills
THEN: The international Estate agent forecast a 3.5% rise in 2022, continuing to a 15% overall rise by 2026 [57]. They also predicted a 4% rise for 2021, then upgraded it at the half year point to 9%. The actual growth for the year was 9.9% [58].
NOW: Their commentators have learned to be a little more measured in their pronouncements. For 2023, they now say:
“A new prime minister and fiscal policy U-turns appear to have reduced some of the pressure on interest rates, but affordability will still come under real pressure as the effect of higher interest rates feeds into buyers’ budgets. That, coupled with the significant cost of living pressures, means we expect to see prices fall by as much as 10% next year during a period of much reduced housing market activity.” [59]
With the following qualifier:
“On the basis that:
- Mortgage markets settle down, with a marked reduction in lenders’ margins over the next 12 months; and
- Bank base rate gradually reduces from the middle of 2024 as inflation is tamed,
Savills expect a marked improvement in mortgage affordability. Combined with nominal price falls of -10% in 2023 (-12.6% adjusted for inflation), that would gradually bring more buyers into the market and allow a return to modest house price growth from 2024 onwards, with a more pronounced rebound in 2026.”
In summary, if interest rates drop back in 2024, Savills is forecasting that values should then start to recover and that the average UK house price will rise by 6% net in nominal terms over the next five years.
They also expect housing transactions to fall to just under three quarters of the pre-pandemic norm, as first time buyers and buy-to-let investors feel the pressure of affordability next year, and the Bank base rate to peak at 4.0%.
By end of the 2027, they expect the average UK house price to reach £381,578 – a £22,290 gain over five years, and a chunky £92,000 higher than before the pandemic, having had two and a half years of significant growth (+24% to the end of September).
Lucian Cook, Savills head of residential research, adds:
“There are several factors that will insulate the market from the risk of a bigger downturn as seen after the financial crisis. Borrowers who haven’t locked into five-year fixed rates had their affordability heavily stress-tested until August this year. This, combined with relatively modest unemployment expectations and signs that lenders are looking to work with existing borrowers to help them manage their household finances, should limit the amount of forced-sale stock hitting the market next year.
“And looking longer term, the Bank of England’s relaxation of mortgage regulation over the summer has substantially enhanced the prospect of a price recovery; but only as and when interest rates start to be reduced, once inflationary pressures in the wider economy ease.
“Meanwhile, rental value growth will continue to outpace earnings growth in the short-term because of the pronounced imbalance between supply and demand, which will come as positive news to landlords already facing higher borrowing costs, but will put increasing pressure on struggling tenants.”
Savills also expect the mainstream housing markets furthest from London – where mortgages are more affordable – to perform strongest over the next five years, with “slightly less short term downward pressure on prices and more capacity for price growth during the recovery”.
Savills research analyst, Frances McDonald, takes up the baton: “Historical trends suggest that, from a geographical perspective at least, we are just over halfway through the second half of a housing market cycle. And we expect cyclical factors, which are closely linked to affordability, to continue to take precedence over the regional distribution of economic growth over the next five years.
“However, regional price growth is expected to converge around the UK average at the end of our forecast period as the value gap shrinks, potentially putting London and the South East back in a position to deliver the strongest house price growth from 2027 onwards.”
So what do we think? – Conclusion
“Trussonomics is an easy scapegoat for lazy journalists to explain the current economic situation – but as so often, it’s much more complex than that. The “Fiscal Event” may have been the catalyst, but it was far from being the only cause. True, it probably exacerbated the outcome when the markets were already jittery – their projected mortgage rates for summer 2023 had rocketed to 4.6% from the 2.7% projection in July [60] – but as the smoke clears, we have to look at the landscape through grown up eyes and realise it’s actually a reckoning for the pandemic and Ukraine war.
The payback had to come. Taxes had to rise and services had to be squeezed to pay for the black hole created by lockdown, and it’s pure bad luck that we’re having to do this at a time when Mr. Putin has his foot on the fuel supply pipes, causing the prices of just about everything that has to be heated, made or transported to spiral into the stratosphere.
Turning to the property specifics, it’s not easy to pull together a consensus – but if there is one, it seems to be around the level of a 10-12% drop over two years. A loss of the last 12 month’s extraordinary and unnatural growth (which was boosted in part by the end of the stamp duty holiday) and, to be fair, a far better situation than the 2008 crash.
Nevertheless, with the tombola of current events spinning at the speed it currently is, the fundamentals can, and do, change daily (otherwise we’d have produced this report in a fifth of the time – we actually waited until things had settled down a little before publishing), so we’d advise readers to forge their own informed conclusions from all the above.
So what does this mean for CapitalStackers investors in particular? Well, essentially, a 75% LTV would become 85% on the back of this predicted fall in values – but this is far from a disaster as long as the modelling of the debt takes into account proper contingencies, building delays and longer sales tails. These elements, of course, are always built into CapitalStackers deals.
A further comfort to CapitalStackers investors in the darker days ahead will be this: the beauty of lending is that someone else is taking the equity risk. Our loan-based crowdfunding model means that you, the ordinary investor, lend alongside a bank, which (together with the borrower’s equity) adds extra layers of reassurance. And since the risks have been priced into the deals anyway, you have a clearer vision of the future, even when the world itself gets messy.
This clarity and comfort will go some way to explain why (judging by our deals pipeline), even amidst a backdrop of economic chaos, in our oasis of relative calm, developers are still keen to develop, and investors are still keen to invest.
END
6 December 22
STOP PRESS
7 December 22
More figures, but don’t panic.
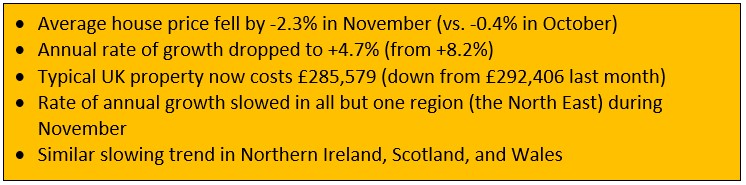
As we stated in the blog, the volatility of the market means that we will be seeing a rollercoaster of figures over the next few months – many of them appearing to disagree, for reasons explained in our 6th December blog. And due to the kaleidoscope of changing factors over the last two years, this very volatility means short term changes are largely incomparable with changes in previous years. Only the day after we published the blog, the Halifax has released its latest figures [1] telling us that UK house prices contracted 2.3 per cent between October and November – going down for the third consecutive month and faster than at any time since the financial crisis in 2008. At the same time, HMRC tells us actual house sales went up in October and the RICS reports that new buyer enquiries went down for the sixth month in a row (see below)
This is to be expected – the ONS figures are also due out next week and going by past trends, will not disagree wildly with the numbers from the Halifax, and last week, the Nationwide reported the largest fall since June 2020.
However, so far these are the effects of factors already priced in to the consensus of a prospective 10-12% drop over the next two years. Nothing has happened to change the predicted trajectory – so for now, we’re simply watching this “normalisation” play out and trying not to get too het up over short term see-sawing.
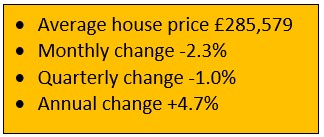
Kim Kinnaird, Director, Halifax Mortgages, said: “Average house prices fell in November as the rate of annual growth slowed further to +4.7% (from +8.2%), with the typical UK property price now sitting at £285,579. The monthly drop of -2.3% is the largest seen since October 2008 and the third consecutive fall.
“While a market slowdown was expected given the known economic headwinds – and following such extensive house price inflation over the last few years (+19% since March 2020) – this month’s fall reflects the worst of the market volatility over recent months.
“Some potential home moves have been paused as homebuyers feel increased pressure on affordability and industry data continues to suggest that many buyers and sellers are taking stock while the market continues to stabilise.
“When thinking about the future for house prices, it is important to remember the context of the last few years, when we witnessed some of the biggest house price increases the market has ever seen. Property prices are up more than £12,000 compared to this time last year, and well above pre-pandemic levels (+£46,403 vs March 2020).
“The market may now be going through a process of normalisation. While some important factors like the limited supply of properties for sale will remain, the trajectory of mortgage rates, the robustness of household finances in the face of the rising cost of living, and how the economy – and more specifically the labour market – performs will be key in determining house prices changes in 2023.”
Interesting stuff we can glean from today’s Halifax figures
In terms of regional change, the North East of England (average property price of £173,587) is bucking the trend with its rate of annual growth actually going up to +10.5% (from +10.4%) and being the only remaining area of the UK with annual house price inflation in double figures.
The sharpest slowdown of annual growth came in the key areas for property inflation during the pandemic – Wales (+7.9%, down from +11.5%: average price of £220,689) and the South West (+8.4%, down from +10.7%: average price of £307,750). This is a possible indicator that factors which used to set buyers’ hearts racing (e.g. the race for space and the lure of the countryside) are now less stimulating.
The pace of annual property price inflation also slowed in London, which continues to lag the other UK regions and nations. House prices have risen +5.2% over the last 12 months, down from +6.6%. The average property price in the capital remains well above the UK average at £549,160.
Some more interesting numbers
- HMRC monthly property transaction data shows UK home sales increased in October 2022. UK seasonally adjusted (SA) residential transactions in October 2022 were 108,480 – up by 2.3% from September’s figure of 106,040 (down 3.1% on a non-SA basis). Quarterly SA transactions (August-October 2022) were approximately 2.3% higher than the preceding three months (May 2022 – July 2022). Year-on-year SA transactions were 38.0% higher than October 2021 (29.1% higher on a non-SA basis). (Source: HMRC)
- Latest Bank of England figures show the number of mortgages approved to finance house purchases decreased in October 2022, by 10.6% to 58,977. Year-on-year the October figure was 15.1% below October 2021. (Source: Bank of England, seasonally adjusted figures)
- The October 2022 RICS Residential Market Survey results point to a continued downward trend in market conditions. New buyer enquiries fell for a sixth month in a row to a net balance of -55%, compared to -36% previously. Agreed sales had a net balance of -45% (-29% previously) and new instructions returned a net balance of -17% (previously -13%). (Source: Royal Institution of Chartered Surveyors’ (RICS) monthly report)
P.S. We really must get on with other stuff and so we don’t propose to add any more addendums to this blog as things unfold. However, many of the above links will likely be updated with new data at source when it becomes available.
Don’t invest unless you’re prepared to lose all your money. This is a high risk investment. You may not be able to access your money easily and are unlikely to be protected if something goes wrong. Take 2 minutes to learn more.